Key Takeaways
- The stock market’s movements can be compared to ripples in water when you drop a pebble in: big at first, but evening out over time.
- Looking at 20-year cycles, versus performance over one year, can provide a better perspective of the stock market.
- A blended 50/50 portfolio of stocks and bonds can help keep you in the market in the long term.
Have you ever observed a rock or a pebble being thrown into a pond? At first, the waves that result are fairly large, but eventually, they subside and the water flattens out. The stock market shares some similarities, in that it can have a really big wave, either up or down – but over time, it evens out.

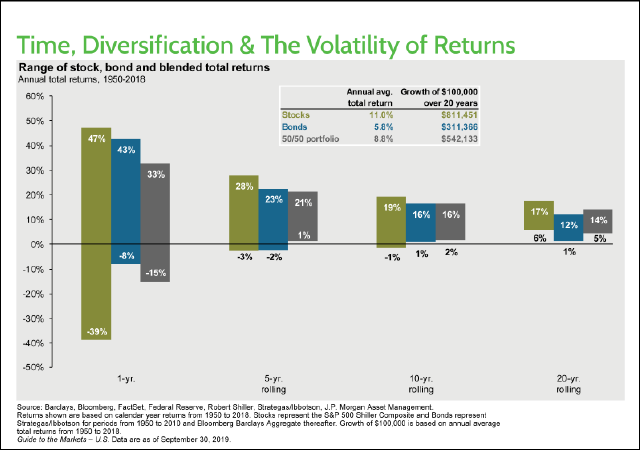
This particular chart, showing 20-year cycles going back to 1950, demonstrates these waves and the subsequent evening out:

Take a look at the far left section, showing one year. The first year shows stocks at -39% in one year and +47% in another year. Bonds are -8% and +43% in total returns. A 50/50 portfolio, which tends to be what most people have, is at -15% and +33%.
Now go to the far right of the chart and look at the 20-year rolling section. Here you’ll see much smaller ripples – stocks range from +6% to +17%. A 50/50 portfolio is +5% to +14%. If you only look at these numbers, you may be tempted to stick with stocks alone. However, look back at that first year. That volatility scares a lot of people and they jump at the wrong time, selling when they shouldn’t.
This is why a blended portfolio, closer to that 50/50 mix, with returns that aren’t that far off from the 100% stocks scenario, keeps people in the market for the long term. This balance helps you make it through those bad waves that happen from time to time – your eggs aren’t all in one basket, so to speak.

So when you’re saving for retirement, keep these 20-year cycles in mind. Don’t think about that first year. You’ll get a decent rate of return if these historical trends hold up over time. Until next time, enjoy.

